Graphical display#
This tutorial demonstrates how to create a display with interactive graphics, as the saying goes "a picture is worth a thousand words".
WPF is a graphics rich user interface technology with sophisticated support for high resolution bitmap and vector graphics with complex animations, transitions and effects.
WPF provides a multitude of ways to display graphics with competing programming complexity and performance characteristics.
This tutorial demonstrates a couple of approaches at each end of the complexity/performance spectrum
- Use of Shapes that are easy to program but performance will suffer if over used
- Use of DrawingContext that is harder to program but more suitable for highly interactive complex vector graphics
Note
The code for this tutorial can be reviewed at Tutorials/DriverDisplayPlugin
Common setup#
Start the tutorial by creating a new display from scratch named DriverDisplayPlugin.
Update the View Model class#
Derive from TemplateDisplayViewModelBase and allow parameters by specifying the DisplayPluginSettings attribute
    [DisplayPluginSettings(ParametersMaxCount = 2)]
    public sealed class SampleDisplayViewModel : TemplateDisplayViewModelBase
Inject the ISignalBus, IDataRequestSignalFactory and ILogger services into the View Model constructor and pass to the base constructor
public SampleDisplayViewModel(
    ISignalBus signalBus,
    IDataRequestSignalFactory dataRequestSignalFactory,
    ILogger logger) :
        base(signalBus, dataRequestSignalFactory, logger)
Using Shapes#
For the majority of use cases, WPF shapes provides an ideal compromise between programming simplicity and performance.
The shape elements can be added to the View XAML as per standard User Interface elements such as TextBlock, and standard binding to View Model properties can be used to change attributes such as colour, position or size. WPF animations can also be used to add additional flare as required.
A perfect example of using WPF shapes is to represent bit field parameters with appropriate graphics.
This example shows how to display a dynamic representation of the PCU8D shift light LEDs.
The LEDs are represented by a single parameter (e.g. NLEDStatusAll, verify from ATLAS settings or ask your System Administrator)
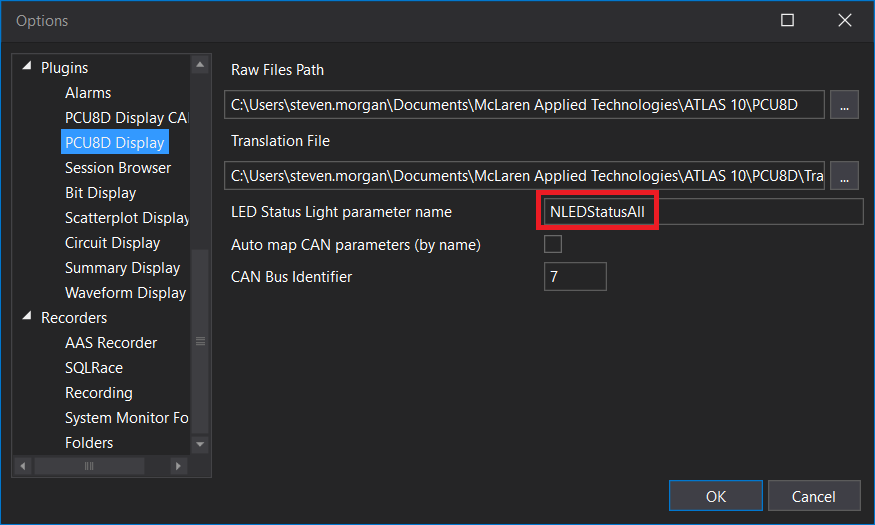
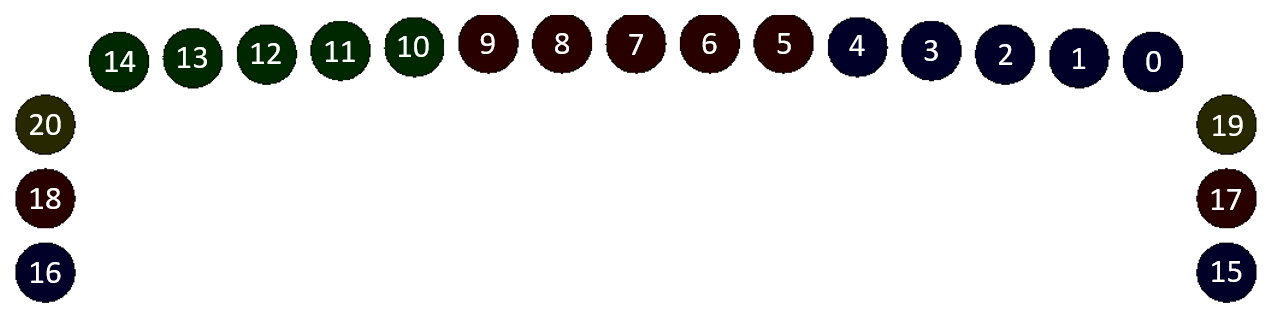
Bit positions are mapped to the following LEDs
Add LED View Model class#
Add a simple View Model class to represent an LED
Colorfield namedoffColorthat is the colour displayed when the LED is off (passed to constructor)Colorfield namedonColorthat is the colour displayed when the LED is on (passed to constructor)intfield namedbitIndexthat is bit position of the LED (passed to constructor)Colorfield namedcoloras backer for theColorpropertydoublefield namedshiftYas backer for theShiftYproperty (passed to constructor)Colorproperty namedColorthat is the current color of the LEDdoubleproperty namedShiftYthat is the optional distance to shift LED in the Y directionUpdateColor()method that takes aBitArrayand sets the LED color based on the state of the bit atbitIndex
public sealed class LedViewModel : BindableBase
{
    private readonly Color offColor;
    private readonly Color onColor;
    private readonly int bitIndex;
    private Color color;
    private double shiftY;

    public LedViewModel(Color offColor, Color onColor, int bitIndex, double shiftY)
    {
        this.offColor = offColor;
        this.onColor = onColor;
        this.bitIndex = bitIndex;
        this.shiftY = shiftY;

        this.color = offColor;
    }

    public Color Color
    {
        get => this.color;
        set => SetProperty(ref this.color, value);
    }

    public double ShiftY
    {
        get => this.shiftY;
        set => SetProperty(ref this.shiftY, value);
    }

    public void UpdateColor(BitArray bits) => this.Color = bits[bitIndex] ? this.onColor : this.offColor;
}
Update the View class#
Configure the user interface as follows
- Add
ColorToSolidColorBrushValueConverterto theResources - Wrap a fixed size
GridofHeight=1000within aViewBoxandDockPanel- Configure two rows of
Height=100andHeight=* - Configure three columns of
Width=100,Width=*andWidth=100
- Configure two rows of
- Use an
ItemsControlto display the top shift lights atRow=0andColumn=1- Bind
ItemsSourceattribute to the View ModelTopShiftLightsproperty - Set the
ItemsPanelelement to aUniformGridwithRows=1andColumns=15 - Set the
ItemTemplateelement to aDataTemplatecontaining a uniformViewBox- Set the
RenderTransformelement to aTranslateTransform- Set
X=0 - Bind the
Yattribute to the LED View ModelShiftYproperty
- Set
- Set the
ViewBoxcontents to anEllipseshape ofWidth=100andHeight=100- Bind the
Fillattribute to the LED View ModelColorproperty withConverter=ColorToSolidColorBrushValueConverter
- Bind the
- Set the
- Bind
- Use an
ItemsControlto display the left shift lights atRow=1andColumn=0- Bind
ItemsSourceattribute to the View ModelLeftShiftLightsproperty - Set the
ItemsPanelelement to aStackPanelwithOrientation=Vertical - Set the
ItemTemplateelement to aDataTemplatecontaining a uniformViewBoxcontaining anEllipseshape ofWidth=100andHeight=100- Bind the
Fillattribute to the LED View ModelColorproperty withConverter=ColorToSolidColorBrushValueConverter
- Bind the
- Bind
- Use an
ItemsControlto display the right shift lights atRow=1andColumn=2- Bind
ItemsSourceattribute to the View ModelRightShiftLightsproperty - Set the
ItemsPanelelement to aStackPanelwithOrientation=Vertical - Set the
ItemTemplateelement to aDataTemplatecontaining a uniformViewBoxcontainingEllipseshape ofWidth=100andHeight=100- Bind the
Fillattribute to the LED View ModelColorproperty withConverter=ColorToSolidColorBrushValueConverter
- Bind the
- Bind
<UserControl.Resources>
    <converters:ColorToSolidColorBrushValueConverter x:Key="ColorToSolidColorBrushValueConverter" />
</UserControl.Resources>

<DockPanel>
    <Viewbox>
        <Grid Height="1000">
            <Grid.RowDefinitions>
                <RowDefinition Height="100" />
                <RowDefinition Height="*" />
            </Grid.RowDefinitions>
            <Grid.ColumnDefinitions>
                <ColumnDefinition Width="100" />
                <ColumnDefinition Width="*" />
                <ColumnDefinition Width="100" />
            </Grid.ColumnDefinitions>

            <ItemsControl Grid.Row="0"
                          Grid.Column="1"
                          ItemsSource="{Binding TopShiftLights}">
                <ItemsControl.ItemsPanel>
                    <ItemsPanelTemplate>
                        <UniformGrid Rows="1" Columns="15" />
                    </ItemsPanelTemplate>
                </ItemsControl.ItemsPanel>
                <ItemsControl.ItemTemplate>
                    <DataTemplate>
                        <Viewbox Stretch="Uniform" Margin="10">
                            <Viewbox.RenderTransform>
                                <TranslateTransform X="0" Y="{Binding ShiftY}" />
                            </Viewbox.RenderTransform>
                            <Ellipse Width="100" Height="100"
                                     Fill="{Binding Color, Converter={StaticResource ColorToSolidColorBrushValueConverter}}" />
                        </Viewbox>
                    </DataTemplate>
                </ItemsControl.ItemTemplate>
            </ItemsControl>

            <ItemsControl Grid.Row="1"
                          Grid.Column="0"
                          ItemsSource="{Binding LeftShiftLights}">
                <ItemsControl.ItemsPanel>
                    <ItemsPanelTemplate>
                        <StackPanel Orientation="Vertical" />
                    </ItemsPanelTemplate>
                    </ItemsControl.ItemsPanel>
                <ItemsControl.ItemTemplate>
                    <DataTemplate>
                        <Viewbox Stretch="Uniform" Margin="10">
                            <Ellipse Width="100" Height="100"
                                     Fill="{Binding Color, Converter={StaticResource ColorToSolidColorBrushValueConverter}}" />
                        </Viewbox>
                    </DataTemplate>
                </ItemsControl.ItemTemplate>
            </ItemsControl>

            <ItemsControl Grid.Row="1"
                          Grid.Column="2"
                          ItemsSource="{Binding RightShiftLights}">
                <ItemsControl.ItemsPanel>
                    <ItemsPanelTemplate>
                        <StackPanel Orientation="Vertical" />
                    </ItemsPanelTemplate>
                </ItemsControl.ItemsPanel>
                <ItemsControl.ItemTemplate>
                    <DataTemplate>
                        <Viewbox Stretch="Uniform" Margin="10">
                            <Ellipse Width="100" Height="100"
                                     Fill="{Binding Color, Converter={StaticResource ColorToSolidColorBrushValueConverter}}" />
                        </Viewbox>
                    </DataTemplate>
                </ItemsControl.ItemTemplate>
            </ItemsControl>

            <Grid Grid.Row="1"
                  Grid.Column="1"
                  Margin="20">
                  <!-- added later -->
            </Grid>
        </Grid>
    </Viewbox>
</DockPanel>
Update the View Model class#
Subscribe to SampleResultSignal in the View Model constructor to handle the result of a sample data request
this.Disposables.Add(
    this.SignalBus.Subscribe<SampleResultSignal>
        this.HandleSampleResultSignal,
        r => r.SourceId == this.ScopeIdentity.Guid));
Add an OperationTracker<SampleRequestSignal> field named sampleRequestTracker to throttle sample data requests
private readonly OperationTracker<SampleRequestSignal> sampleRequestTracker;
Instantiate sampleRequestTracker in the View Model constructor
this.sampleRequestTracker = new OperationTracker<SampleRequestSignal>(ThrottleInterval, signalBus.Send);
Add static fields for the various LED on and off colors
private static readonly Color BlueOff = Color.FromArgb(255, 0, 0, 40);
private static readonly Color BlueOn = Color.FromArgb(255, 0, 0, 255);
private static readonly Color GreenOff = Color.FromArgb(255, 0, 40, 0);
private static readonly Color GreenOn = Color.FromArgb(255, 0, 255, 0);
private static readonly Color RedOff = Color.FromArgb(255, 40, 0, 0);
private static readonly Color RedOn = Color.FromArgb(255, 255, 0, 0);
private static readonly Color YellowOff = Color.FromArgb(255, 40, 40, 0);
private static readonly Color YellowOn = Color.FromArgb(255, 255, 255, 0);
Add properties that represent the left, top and right LED strips
[Browsable(false)]
public List<LedViewModel> TopShiftLights { get; } = new List<LedViewModel>()
{
    new LedViewModel(GreenOff, GreenOn, 14, 15),
    new LedViewModel(GreenOff, GreenOn, 13, 10),
    new LedViewModel(GreenOff, GreenOn, 12, 5),
    new LedViewModel(GreenOff, GreenOn, 11, 0),
    new LedViewModel(GreenOff, GreenOn, 10, -5),
    new LedViewModel(RedOff, RedOn, 9, -10),
    new LedViewModel(RedOff, RedOn, 8, -10),
    new LedViewModel(RedOff, RedOn, 7, -10),
    new LedViewModel(RedOff, RedOn, 6, -10),
    new LedViewModel(RedOff, RedOn, 5, -10),
    new LedViewModel(BlueOff, BlueOn, 4, -5),
    new LedViewModel(BlueOff, BlueOn, 3, 0),
    new LedViewModel(BlueOff, BlueOn, 2, 5),
    new LedViewModel(BlueOff, BlueOn, 1, 10),
    new LedViewModel(BlueOff, BlueOn, 0, 15)
};

[Browsable(false)]
public List<LedViewModel> LeftShiftLights { get; } = new List<LedViewModel>()
{
    new LedViewModel(YellowOff, YellowOn, 20, 0),
    new LedViewModel(RedOff, RedOn, 18, 0),
    new LedViewModel(BlueOff, BlueOn, 16, 0)
};

[Browsable(false)]
public List<LedViewModel> RightShiftLights { get; } = new List<LedViewModel>()
{
    new LedViewModel(YellowOff, YellowOn, 19, 0),
    new LedViewModel(RedOff, RedOn, 17, 0),
    new LedViewModel(BlueOff, BlueOn, 15, 0)
};
Override the OnMakeCursorDataRequestsAsync() method to issue a sample data request for the first display parameter when the cursor timestamp changes
protected override Task OnMakeCursorDataRequestsAsync(ICompositeSession compositeSession)
{
    if (this.DisplayParameterService.PrimaryParameters.Count < 1)
    {
        return Task.CompletedTask;
    }

    var signal = this.DataRequestSignalFactory.CreateSampleRequestSignal(
        this.ScopeIdentity.Guid,
        compositeSession.Key,
        this.DisplayParameterService.PrimaryParameters.FirstOrDefault(),
        compositeSession.CursorPoint + 1,
        1,
        SampleDirection.Previous);

    this.sampleRequestTracker.Add(signal);

    return Task.CompletedTask;
}
Note
Rather than send the signal directly to the SignalBus, add it to sampleRequestTracker
Add the HandleSampleResultSignal() method to update the LED colours
private void HandleSampleResultSignal(SampleResultSignal signal)
{
    var result = signal.Data;

    var parameterValues = result.ParameterValues;
    parameterValues.Lock();

    try
    {
        if (parameterValues.SampleCount == 1)
        {
            var shiftLightsValue = (uint) parameterValues.Data[0];
            var bits = new BitArray(BitConverter.GetBytes(shiftLightsValue));
            this.TopShiftLights.ForEach(sl => sl.UpdateColor(bits));
            this.LeftShiftLights.ForEach(sl => sl.UpdateColor(bits));
            this.RightShiftLights.ForEach(sl => sl.UpdateColor(bits));
        }
    }
    finally
    {
        parameterValues.Unlock();
        this.sampleRequestTracker.Complete();
    }
}
Note
In this instance the View Model properties are being modified on the Task Pool.
WPF will handle this special case, more sophisticated updates need to be done by calling the ExecuteOnUiAsync method.
Attention
It is important to call Complete() on OperationTracker<T> to allow subsequent operations to execute
Testing the display#
To view the LED graphics
- Add a session via the Session Browser to the compare set associated with the display
- Add the PCU8D LED display parameter (e.g.
NLEDStatusAll) via the Parameter Browser - Use a Waveform display to change the cursor
Interactive vector graphics#
For complex graphics that change regularly, WPF provides the low-level and efficient DrawingContext class.
The Display Plugin Library VisualLayer class provides a simple way to add DrawingContext graphics to a display.
This example shows how to display a dynamic trace of a parameter and simple cursor.
The simplest way to display a trace is to fetch all the samples of a parameter and draw lines between each.
The trouble is, when viewing multiple laps of a high frequency parameter there could be 100,000+ samples, however even at 4K resolution we couldn't possibly resolve that many samples. Therefore we should re-sample the parameter to a more manageable resolution, e.g. 1000 data points.
Therefore by making a data request instead of a sample data request it doesn't matter how many actual samples there are within the time range
- The time range is divided into an equal time interval per data point, the sample mode determines how the actual samples that fall within each interval are summarized.
The Trace class converts the result of a data request into a collection of lines.
The Cursor class converts the cursor timestamp into a vertical line.
Note
Since the purpose of this example is to demonstrate graphics, Trace and Cursor classes are provided as is and are not guaranteed to cover all edge cases.
Update the View class#
Starting with the XAML from the above example
- Add two overlapping
VisualLayerXAML elements within theGridatRow=1andColumn=1
<displayPluginLibrary:VisualLayer x:Name="TraceVisualLayer" />
<displayPluginLibrary:VisualLayer x:Name="CursorVisualLayer" />
Note
Having separate visual layers for trace and cursor allows them to be drawn independently, improving performance when only one is changing.
DrawingContext is a retained mode graphics system, therefore the previous content persists until refreshed.
In the code behind, associate each VisualLayer with an associated View Model property
public override void OnApplyTemplate()
{
    base.OnApplyTemplate();

    if (this.DataContext is SampleDisplayViewModel vm)
    {
        vm.TraceVisual = this.TraceVisualLayer.Visual;
        vm.CursorVisual = this.CursorVisualLayer.Visual;
    }
}
Update the View Model class#
Add the following backers
Penfield namedcursorPenthat is the graphics pen used to draw the cursor- OperationTracker<(DataRequestSignal, IDisplayParameterContainer)> field named
dataRequestTrackerto throttle data requests - OperationTracker<Trace> field named
redrawTraceRequestTrackerto throttle trace redraw requests - OperationTracker<Cursor> field named
redrawCursorRequestTrackerto throttle cursor redraw requests intfield nameddataRequestSampleCountas backer for theDataRequestSampleCountproperty
private readonly Pen cursorPen = new Pen(Brushes.White, 1);
private readonly OperationTracker<(DataRequestSignal Signal, IDisplayParameterContainer ParameterContainer)> dataRequestTracker;
private readonly OperationTracker<Trace> redrawTraceRequestTracker;
private readonly OperationTracker<Cursor> redrawCursorRequestTracker;
private int dataRequestSampleCount;
Instantiate the operation trackers in the View Model constructor
this.dataRequestTracker = new OperationTracker<(DataRequestSignal Signal, IDisplayParameterContainer)>(
    ThrottleInterval,
    operation => signalBus.Send(operation.Signal));

this.redrawTraceRequestTracker = new OperationTracker<Trace>(
    ThrottleInterval,
    async trace => await this.ExecuteOnUiAsync(() => this.Redraw(trace)));

this.redrawCursorRequestTracker = new OperationTracker<Cursor>(
    ThrottleInterval,
    async cursor => await this.ExecuteOnUiAsync(() => this.Redraw(cursor)));
Note
Trace and Cursor graphics are drawn on the UI thread by calling via the ExecuteOnUiAsync() method
Add the following properties
intproperty namedDataRequestSampleCountthat determines the number of data points to fetch and draw (defaults to 1000)IVisualproperty namedCursorVisualused to draw the cursor (set in the View code behind)IVisualproperty namedTraceVisualused to draw the trace (set in the View code behind)
public int DataRequestSampleCount
{
    get => this.dataRequestSampleCount = this.ReadProperty(1000);
    set
    {
        if (this.SetProperty(ref this.dataRequestSampleCount, value))
        {
            this.SaveProperty(value);
            this.MakeDataRequests(false, true);
        }
    }
}

[Browsable(false)]
public IVisual CursorVisual { get; set; }

[Browsable(false)]
public IVisual TraceVisual { get; set; }
Extend OnMakeCursorDataRequestsAsync() method to instantiate a Cursor instance and add to redrawCursorRequestTracker to initiate a redraw
var cursor = new Cursor(compositeSession.TimebaseRange, compositeSession.CursorPoint);
this.redrawCursorRequestTracker.Add(cursor);
Subscribe to DataResultSignal in the View Model constructor to handle the result of a data request
this.Disposables.Add(
    signalBus.Subscribe<DataResultSignal>(
        this.HandleDataResultSignal,
        r => r.SourceId == this.ScopeIdentity.Guid));
Override the OnMakeTimebaseDataRequestsAsync() method to issue a data request for the second parameter when the timebase timestamp range changes
protected override Task OnMakeTimebaseDataRequestsAsync(ICompositeSession compositeSession)
{
    if (this.DisplayParameterService.PrimaryParameters.Count < 2)
    {
        return Task.CompletedTask;
    }

    // Second parameter is the trace line
    var signal = this.DataRequestSignalFactory.CreateDataRequestSignal(
        this.ScopeIdentity.Guid,
        this.DisplayParameterService.PrimaryParameters.Skip(1).FirstOrDefault(),
        compositeSession.TimebaseRange,
        this.DataRequestSampleCount,
        SampleMode.MaximumToMinimum);

    this.dataRequestTracker.Add((signal, this.DisplayParameterService.ParameterContainers.Skip(1).FirstOrDefault()));
    return Task.CompletedTask;
}
Note
The Trace class needs a SampleMode of MaximumToMinimum in order to render correctly.
Note
Rather than send the signal directly to the SignalBus, add it to dataRequestTracker
Add the HandleDataResultSignal() method to instantiate a Trace instance and add to redrawTraceRequestTracker to initiate a redraw
private void HandleDataResultSignal(DataResultSignal signal)
{
    var request = signal.Data.Request;
    var result = signal.Data;

    var parameterValues = result.ParameterValues;
    parameterValues.Lock();

    try
    {
        if (parameterValues.SampleCount > 0 &&
            this.dataRequestTracker.GetCurrent(out var currentOperation))
        {
            var trace = new Trace(currentOperation.ParameterContainer, request.Parameter, parameterValues);
            this.redrawTraceRequestTracker.Add(trace);
        }
    }
    finally
    {
        parameterValues.Unlock();
        this.dataRequestTracker.Complete();
    }
}
Add the Redraw methods for Trace and Cursor
private void Redraw(Trace trace)
{
    try
    {
        var extents = this.TraceVisual.Extents;
        if (!this.IsDisplayVisible || extents.Width == 0 || extents.Height == 0)
        {
            this.TraceVisual.Draw(delegate { });
            return;
        }

        this.TraceVisual.Draw(
            dc =>
            {
                dc.DrawRectangle(
                    Brushes.Transparent,
                    new Pen(Brushes.White, 1),
                    new Rect(new Point(0, 0), extents));

                var tracePen = new Pen(new SolidColorBrush(trace.TraceColor), extents.Width / trace.PointCount);
                foreach (var (start, end) in trace.GetLines(extents))
                {
                    dc.DrawLine(tracePen, start, end);
                }
            });
    }
    finally
    {
        redrawTraceRequestTracker.Complete();
    }
}

private void Redraw(Cursor cursor)
{
    try
    {
        var extents = this.CursorVisual.Extents;
        if (!this.IsDisplayVisible ||
            extents.Width == 0 ||
            extents.Height == 0 ||
            !cursor.GetCursorLine(extents, out var cursorLine))
        {
            this.CursorVisual.Draw(delegate { });
            return;
        }

        this.CursorVisual.Draw(
            dc =>
            {
                dc.DrawLine(this.cursorPen, cursorLine.Item1, cursorLine.Item2);
            });
    }
    finally
    {
        redrawCursorRequestTracker.Complete();
    }
}
Note
DrawingContext is a retained mode graphics system, therefore to clear it, call Draw() but draw nothing
Testing the display#
To view the trace and cursor graphics
- Add a session via the Session Browser to the compare set associated with the display
- Add a display parameter to visualize (e.g.
vCar) via the Parameter Browser- Ensure there is already one display parameter set for the PCU8D LED visualization
- Use a Waveform display to change the cursor and timebase