Performance and Memory Profilers#
Overview#
From version 11.2.3.460 onwards, ATLAS application now includes Jet Brains dotTrace and dotMemory profilers, which can be accessed via the Tools menu. This function allows users to take snapshots, which can be shared with the ATLAS development team for debugging purposes. Please use this feature only when specifically requested by the development team.
Warning
The profilers capture a large amount of information and will generate a large file. Please limit the amount of time metrics are being captured to minimise the file size.
Capturing Performance Profile#
- Navigate to
Tools > Performance Profiler > Performance > Start.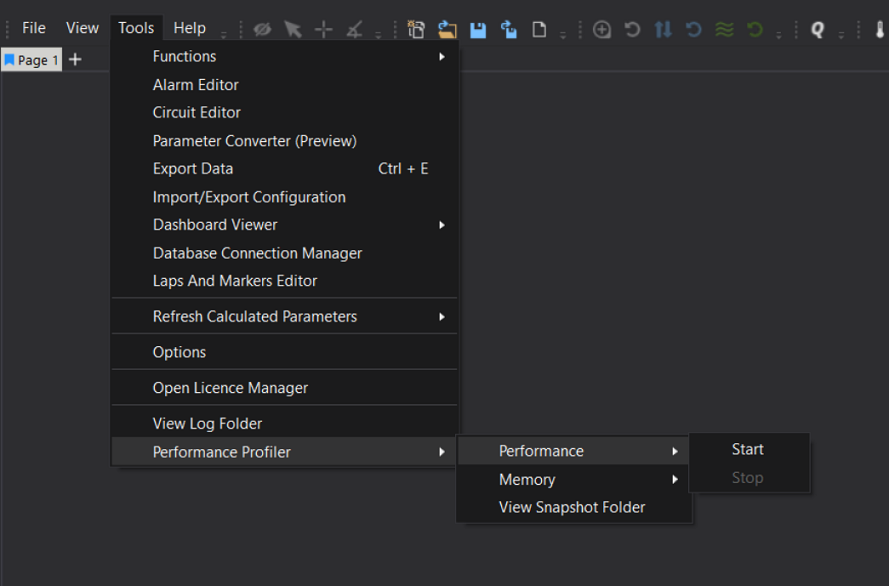
-
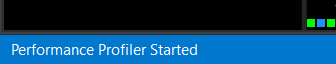
Wait for the status bar to display
Performance Profiler Started.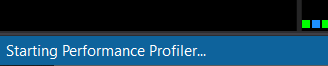
-
Perform the actions that are required to be profiled.
- Stop the profiler by navigating back through the Tools menu.
- Navigate to the snapshot folder via
Tools > Performance Profiler > View Snapshot Folder. - Send the *.dtp and the *.dtp.000# to your McLaren Applied support representative.
Capturing Memory Profile#
- Navigate to
Tools > Performance Profiler > Memory > Start.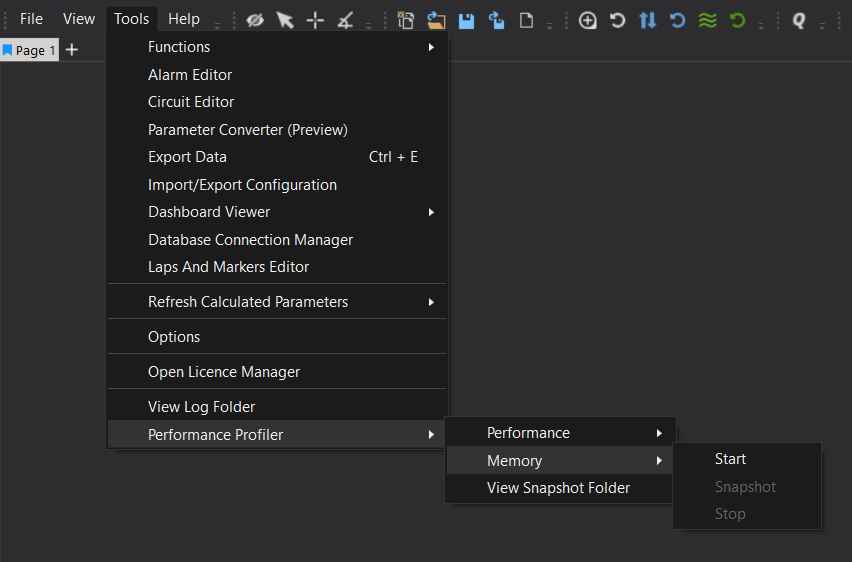
-
Wait for the status bar to display
Memory Profiler Started.
-
Perform the actions that are required to be profiled.
- Create snapshot as required via
Tools > Performance Profiler > Memory > Snapshot. - Stop the profiler by navigating back through the Tools menu.
- Navigate to the snapshot folder via
Tools > Performance Profiler > View Snapshot Folder - Send the *.dmw to your McLaren Applied support representative.