Scatterplot Sampling Modes#
Overview#
In the ATLAS Scatterplot, there is a selection of different Data Point Modes. The different Data Point Mode selection alters the way in which the X, Y (and Z) samples are calculated for plotting co-ordinates on the scatterplot.
These can be accessed via the Display Properties Window for the Scatterplot.
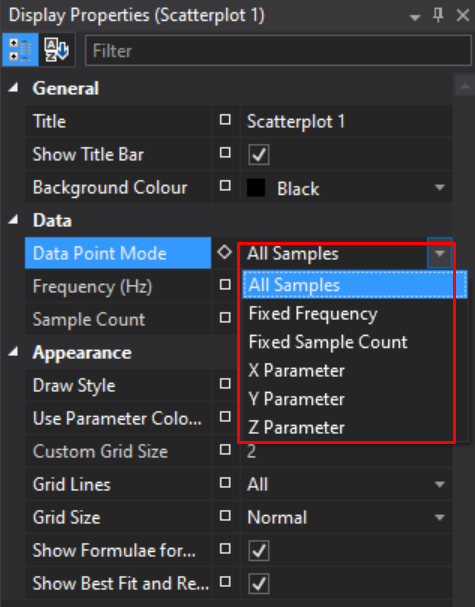
There are 6 different modes, each illustrated below with a worked example:
- All Samples
- Fixed Frequency
- Fixed Sample count
- X Parameter
- Y Parameter
- Z Parameter
This mode setting applies at a display level, so any plots within that display inherit these properties.
All Samples Mode#
ATLAS 10.4.1 and later
Note
In this mode, the Frequency (Hz) and Sample Count fields are ignored and read only.
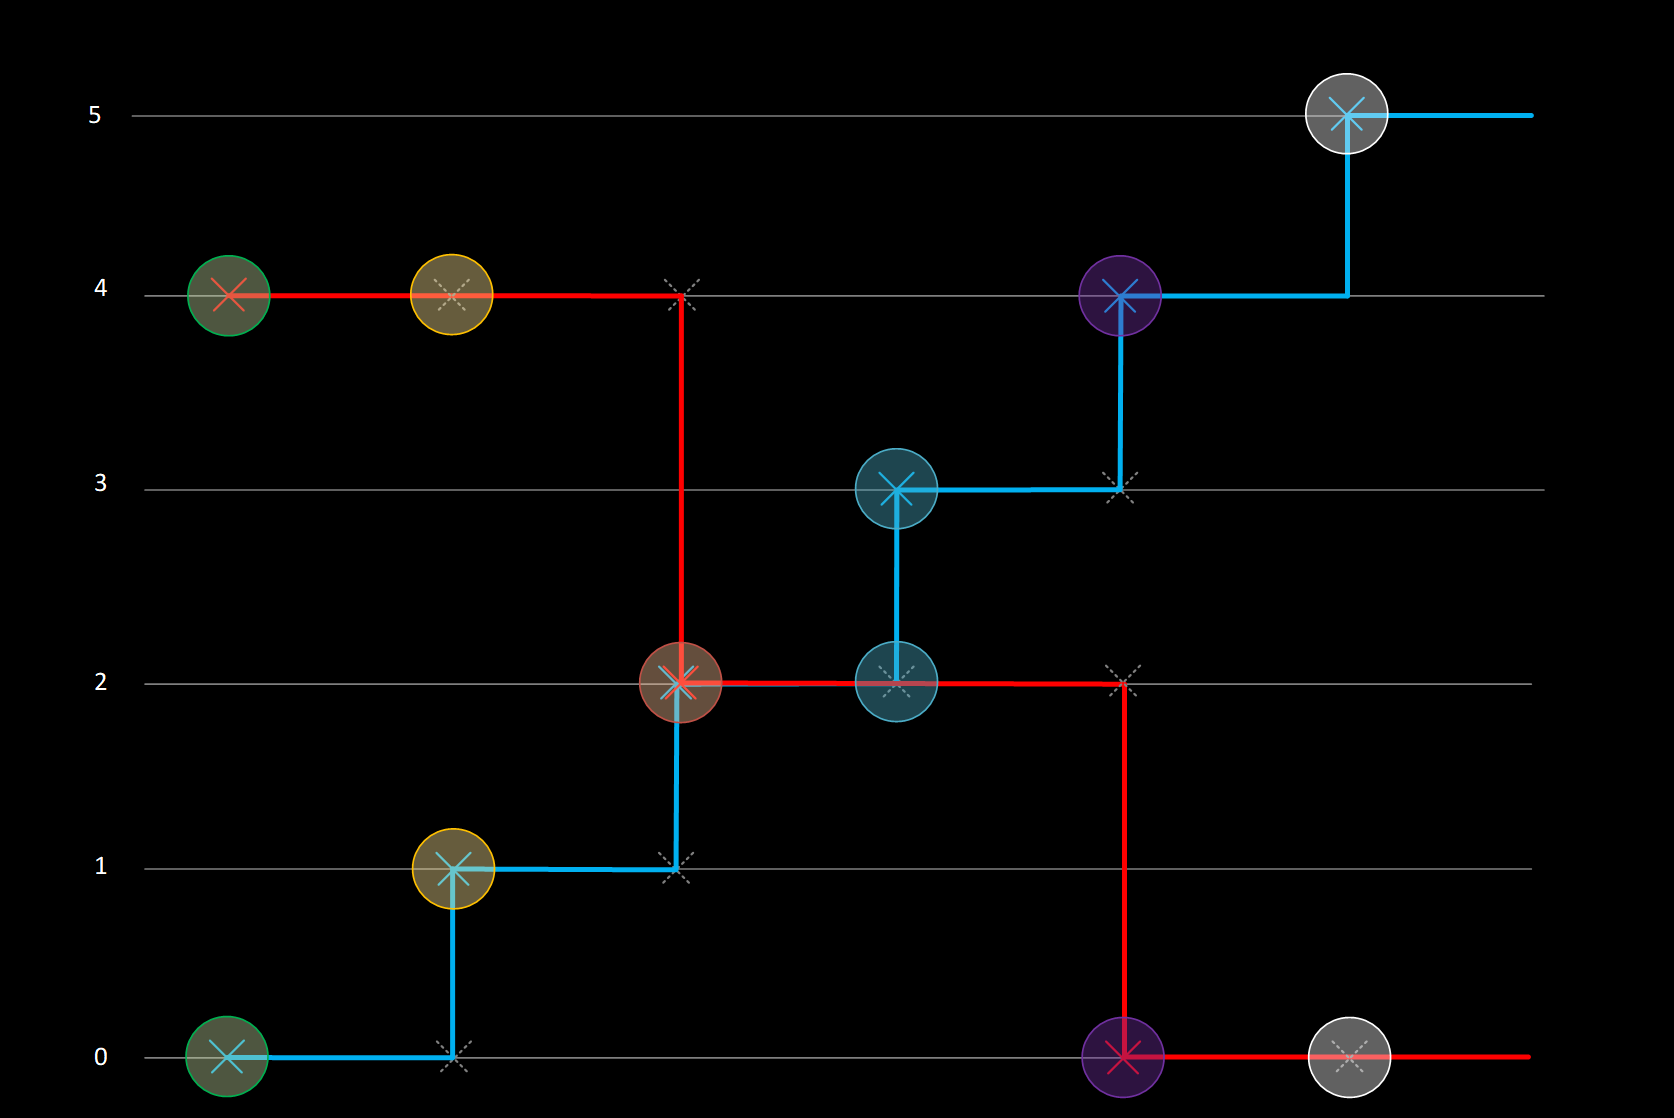
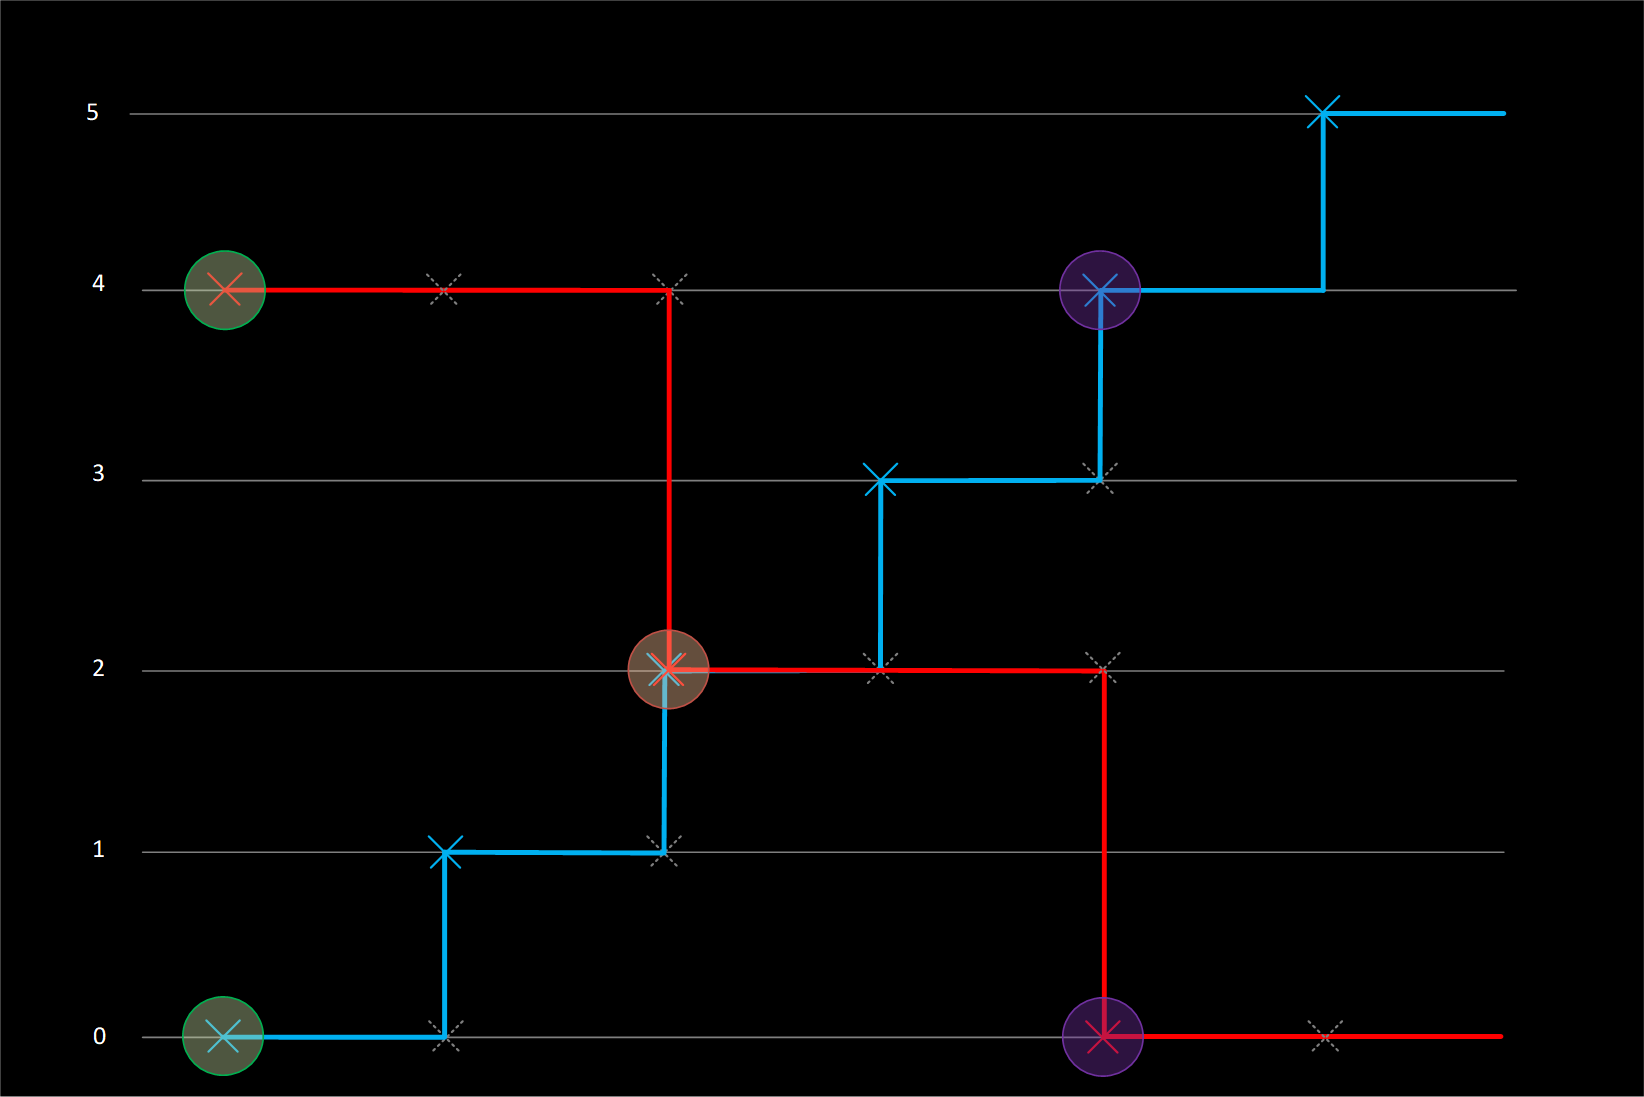
All Samples mode in ATLAS Versions >= 10.4.1 operates by taking each sample of the Highest rate parameter, and referencing the sample and hold values of the other parameter(s). There is no averaging of samples, and only real values will be plotted.
If the X Parameter is logged at 100Hz, and the Y at 10Hz, the Y parameter will effectively be super-sampled at 100Hz in order to plot a point for each X parameter sample. If super-sampling is not desired, we recommend creating a function(s) which down-samples parameters where required, such that X, Y (and Z) are all at the same rate.
Example#
| Time | X Parameter Value (Blue) 2Hz |
Y Parameter Value (Red) 1Hz |
X Co-ordinate plotted |
Y Co-ordinate plotted |
|---|---|---|---|---|
| 0.0 | 0 | 4 | 0 | 4 |
| 0.5 | 1 | 1 | 4 | |
| 1.0 | 2 | 2 | 2 | 2 |
| 1.5 | 3 | 3 | 2 | |
| 2.0 | 4 | 0 | 4 | 0 |
| 2.5 | 5 | 5 | 0 |
X, Y, Z Parameter#
ATLAS 10.4.3 and later
ATLAS 10.4.3 introduced 3 new modes in the scatterplot: X, Y and Z Parameter.
These work in a similar manner to All Samples mode — however instead of inferring the Highest rate parameter and using that to look up corresponding values on the other axes, the user can specify explicitly whether the X, Y or Z parameter is used as the "master".
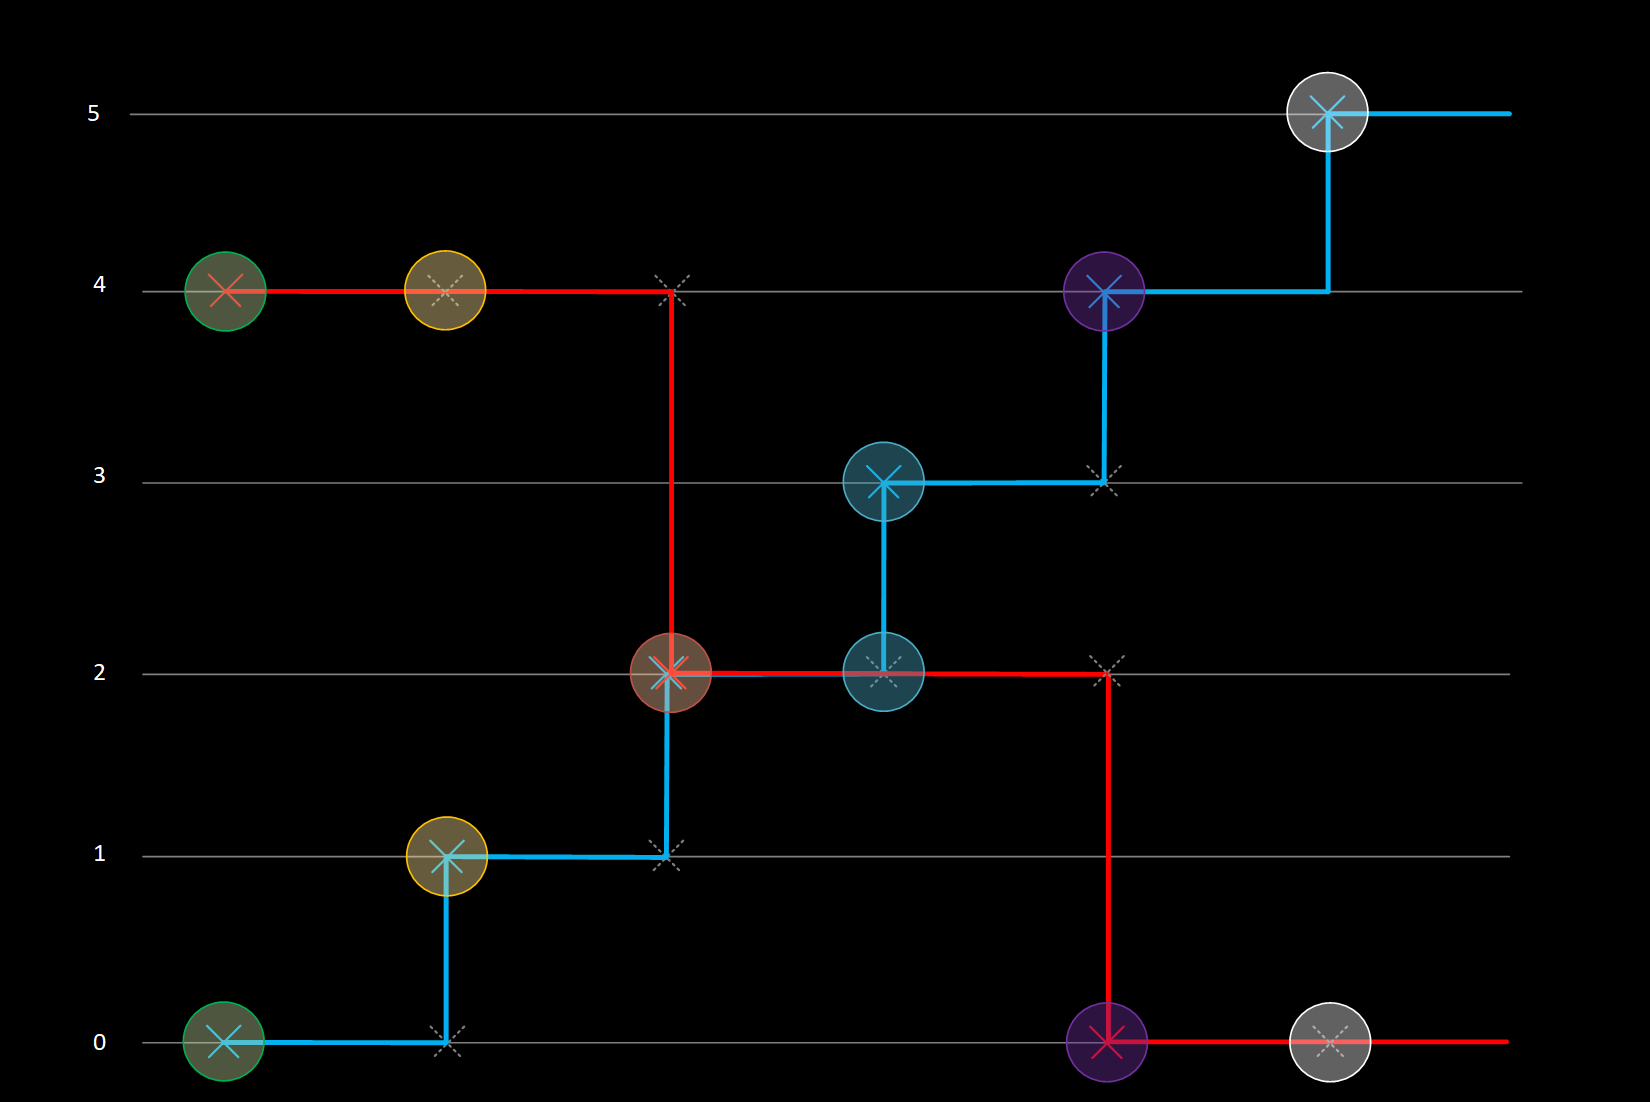
Example — X Parameter#
For every sample of the X Parameter, a corresponding vale of Y (or Z) is referenced regardless of the rate of these parameters:
| Time | X Parameter Value (Blue) 2Hz |
Y Parameter Value (Red) 1Hz |
X Co-ordinate plotted |
Y Co-ordinate plotted |
|---|---|---|---|---|
| 0.0 | 0 | 4 | 0 | 4 |
| 0.5 | 1 | 1 | 4 | |
| 1.0 | 2 | 2 | 2 | 2 |
| 1.5 | 3 | 3 | 2 | |
| 2.0 | 4 | 0 | 4 | 0 |
| 2.5 | 5 | 5 | 0 |
Example — Y Parameter#
For every sample of the Y Parameter, corresponding samples of X (or Z) are referenced:
| Time | X Parameter Value (Blue) 2Hz |
Y Parameter Value (Red) 1Hz |
X Co-ordinate plotted |
Y Co-ordinate plotted |
|---|---|---|---|---|
| 0.0 | 0 | 4 | 0 | 4 |
| 0.5 | 1 | |||
| 1.0 | 2 | 2 | 2 | 2 |
| 1.5 | 3 | |||
| 2.0 | 4 | 0 | 4 | 0 |
| 2.5 | 5 |
Fixed Frequency and Fixed Sample Count Modes#
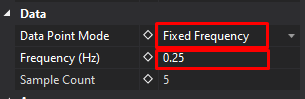
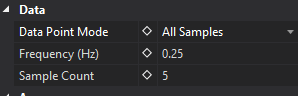
Fixed Frequency mode reads the Frequency (Hz) field, but ignores Sample Count.
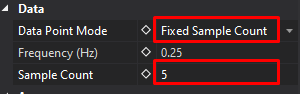
Fixed Sample Count mode reads the Sample Count field, but ignores Frequency (Hz).
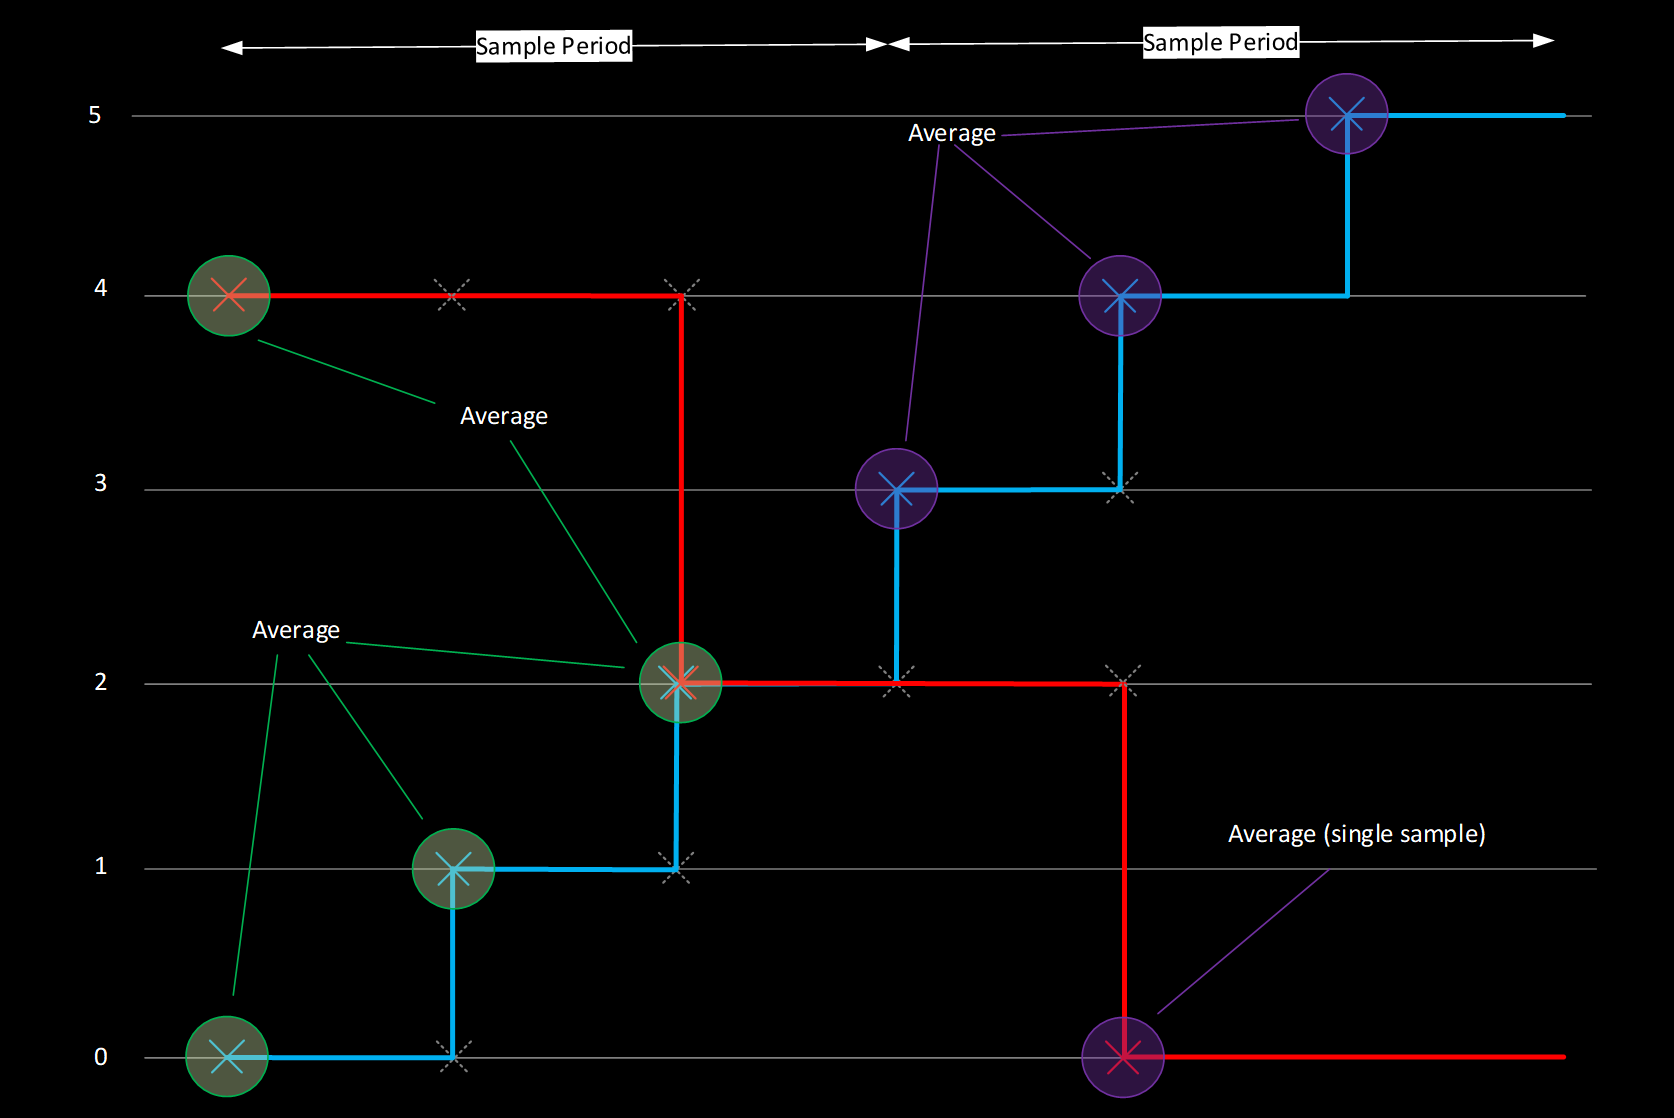
Fixed Frequency & Fixed Sample Count modes calculate samples to plot in a very similar way.
Both of these modes calculate a Time Period and then plot averages of X, Y or Z parameters over that Period.
- If a Period only spans a single sample, then the real sample value will be used;
- If the Period spans multiple samples, then those samples will be averaged.
The only difference between the modes is how the Time Period is calculated.
Fixed Frequency Period Calculation#
Fixed Frequency Sample Time Period is set by a frequency.
Time Period = 1/Frequency (Hz)
If the Frequency is set to 0.25Hz, then the Time period will be 4 seconds (1/0.25).
Fixed Sample Count Period Calculation#
Fixed Sample Count Time Period is set by splitting up the Display Time range, into a number of samples.
Time Period = Display Time Range / Number of Samples
If the Display Time range is displaying 20 seconds of data (can be changed by Zoom Level), and the Number of Samples is set to 5, then the Time Period will be 4 seconds (20/5).
Example — Fixed Frequency & Fixed Sample Counts#
| Time | X Parameter Value (Blue) 2Hz |
Y Parameter Value (Red) 1Hz |
X Co-ordinate plotted |
Y Co-ordinate plotted |
|---|---|---|---|---|
| Sample Period 1 0-1.5 Seconds |
0 | 4 | (0+1+2) / 2 = 1.5 | (4+2) / 2 = 3 |
| 1 | ||||
| 2 | 2 | |||
| Sample Period 2 1.5-3.0 Seconds |
3 | (3+4+5) / 2 = 6 | 0 | |
| 4 | 0 | |||
| 5 |
In the example above, Sample Period of 1.5 seconds could be achieved in both Fixed Frequency or Fixed Sample Count:
Time Period (Fixed Frequency) = 1 / 0.667Hz
Time Period (Number of Samples) = 6 (seconds on display) / 2 (samples)
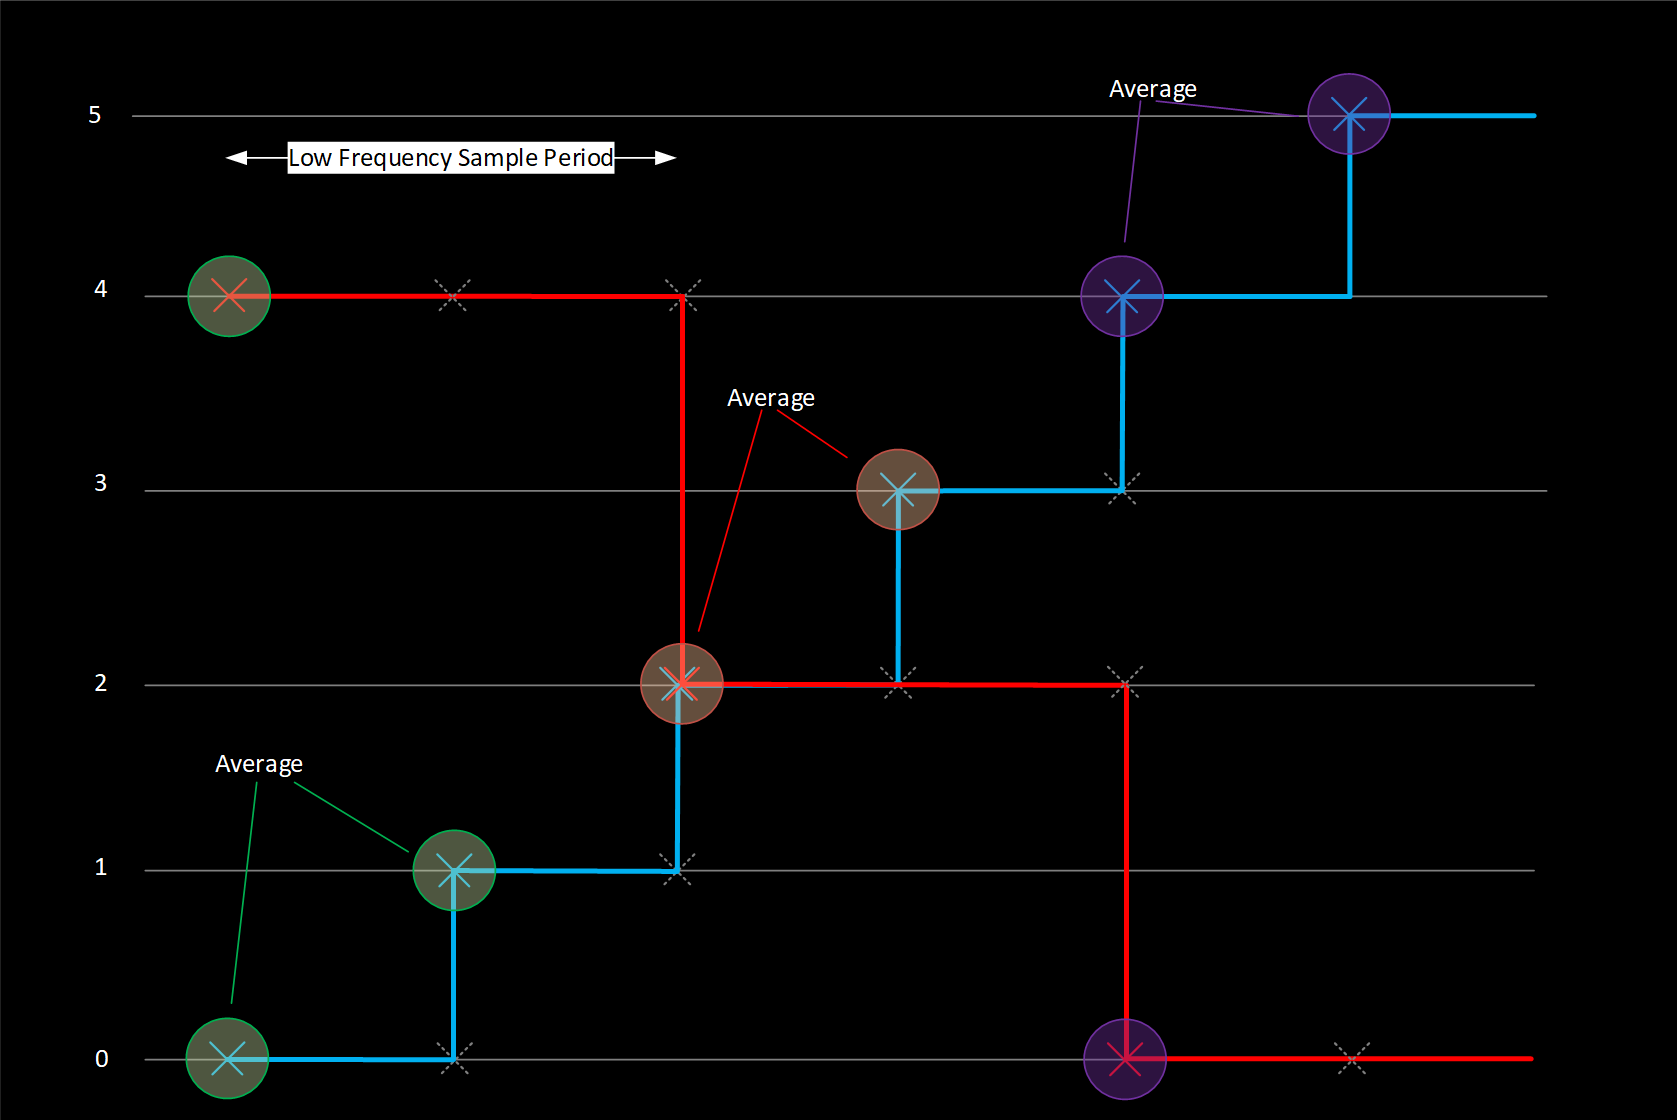
Obsolete Behaviour — Prior to ATLAS 10.4.1#
In ATLAS versions < 10.4.1, All Samples mode worked slightly differently.
Instead of using the Highest Rate parameter, each Sample of the Lowest Rate Parameter is taken, with higher rate parameters being averaged over the period between each Low Rate Parameter Sample. This means that the high rate co-ordinates are averages, and not necessarily real sample values.
Example — All Samples mode prior to ATLAS 10.4.1#
| Time | X Parameter Value (Blue) 2Hz |
Y Parameter Value (Red) 1Hz |
X Co-ordinate plotted |
Y Co-ordinate plotted |
|---|---|---|---|---|
| 0.0-0.5 | 0 | 4 | (0+1) / 2 = 0.5 | 4 |
| 0.5-1.0 | 1 | |||
| 1.0-1.5 | 2 | 2 | (2+3) / 2 = 2.5 | 2 |
| 1.5-2.0 | 3 | |||
| 2.0-2.5 | 4 | 0 | (4+5) / 2 = 4.5 | 0 |
| 2.5-3.0 | 5 |